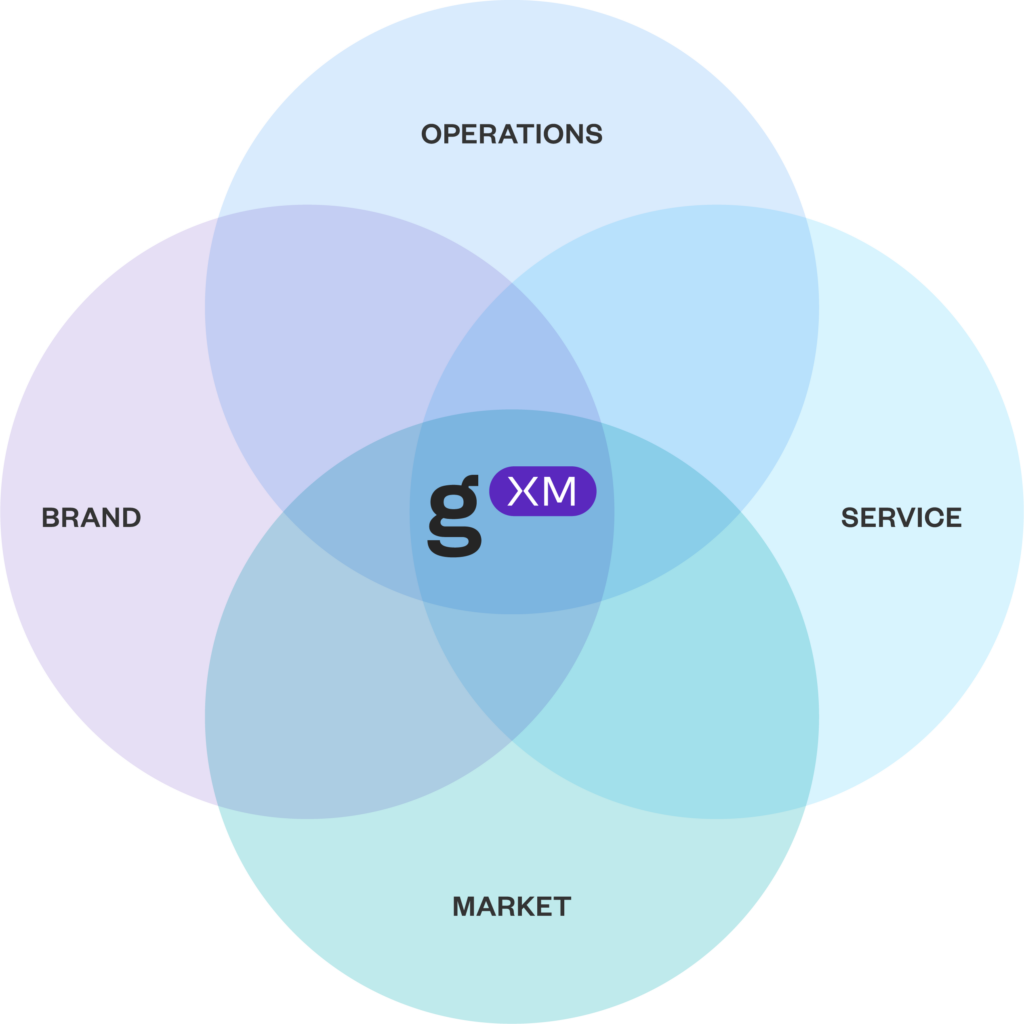
Despite a strong year-over-year jump in positive guest sentiment based on service during May, restaurant guests became less positive when discussing their intent to return to those restaurant brands they visited during the month. Falling intent to return has been the trend since the beginning of the year. But May’s 11.2 percentage point decrease in positive sentiment regarding this key guest satisfaction attribute is the worst year-over-year drop experienced by the industry in 2017, which doesn’t bode well for an industry struggling through almost a decade of declining same-store guest counts. Another worrisome trend may be emerging in the fact that for the second consecutive month, guest satisfaction based on restaurant food has become less positive. The data reflects the same trends when analyzed from a longer time-series perspective: a rolling 3-month average shows positive sentiment declining by 0.2 percentage points when compared with March through May of last year, service scores improved by 15.5 percentage points, but the very important "intent to return" attribute became less positive by 6.7 percentage points.
Conventional wisdom is that a restaurant's ambiance can definitely color a guest's perception of a dining experience and impact their satisfaction. What data has shown is that this guest satisfaction can be also an indicator of restaurant sales performance. During Q1 2017, those brands that had 60 percent or more of their ambiance mentions reflect a positive sentiment achieved 1.4 percentage points higher same-store sales and 1.1 percentage points higher traffic growth. TDn2K research has continuously shown the relationship between sales and traffic performance, guest satisfaction and people metrics such as turnover. In Q1 2017, the best performing restaurant brands based on same-store sales growth had a net positive sentiment 29.1 percent higher than the worse performing brands. Not surprisingly, those best performing brands based on sales growth are also much better at retaining their employees. These top performers reported restaurant management turnover rates 15 percentage points lower than the worst performers and significantly lower hourly turnover as well.
In recent months, it has been common to find cities in California or Florida among the ones with the most positive guest sentiment based on White Box Social Intelligence’s guest satisfaction attributes. However, these two states dominated all six attributes during May. Restaurant guests were especially positive in Sacramento, which was the market with the highest guest satisfaction based on intent to return, value and ambiance. For the second time in the last four months, Orlando was the market with the highest restaurant satisfaction based on service. More importantly, that positive guest sentiment seems to be translating into superior sales performance in those markets. Out of the largest 25 markets in the country, Orlando, Tampa, Sacramento and Los Angeles are among the top five based on average same-store sales for April and May. Guests in Detroit have not been very satisfied with their restaurant experiences in recent months. During May, this city was the worst ranked in guest satisfaction for food, beverage and intent to return. The perception of value has proven to be highly linked to driving guests into restaurants this year. For two consecutive months, the DMA with the least guest satisfaction based on restaurant value has also been the market with the worse same-store traffic growth. During May, that market was Dallas-Ft. Worth.
Guests in the Mountain Plains regions have proven once again they are very positive when it comes to rating their restaurant experiences. For the fifth consecutive month, this has been the region with the highest positive sentiment. The Midwest has also placed among the top three regions during the last two months. On the other end of the spectrum, restaurants operating in New York-New Jersey and New England have tended to receive much less positive reviews this year. Both regions were ranked among the lowest positive guest sentiment during April and May.
The Restaurant Guest Satisfaction Snapshot is produced by White Box Social Intelligence™, a TDn2K Product™. WBSI is tracking over 192 brands to benchmark customer satisfaction and is the only online tool that integrates with operational performance data to validate the impact on financial performance. The algorithm determining ranking brands is based on sentiment and determined by White Box Social Intelligence. Brands included in this monthly snapshot must have a total of at least 250 mentions for the month. Restaurants must have a minimum number of units to be eligible as well. DMA rankings consider only the largest 25 areas.